Decoding the Green: A Comprehensive Guide to plant Zone Maps
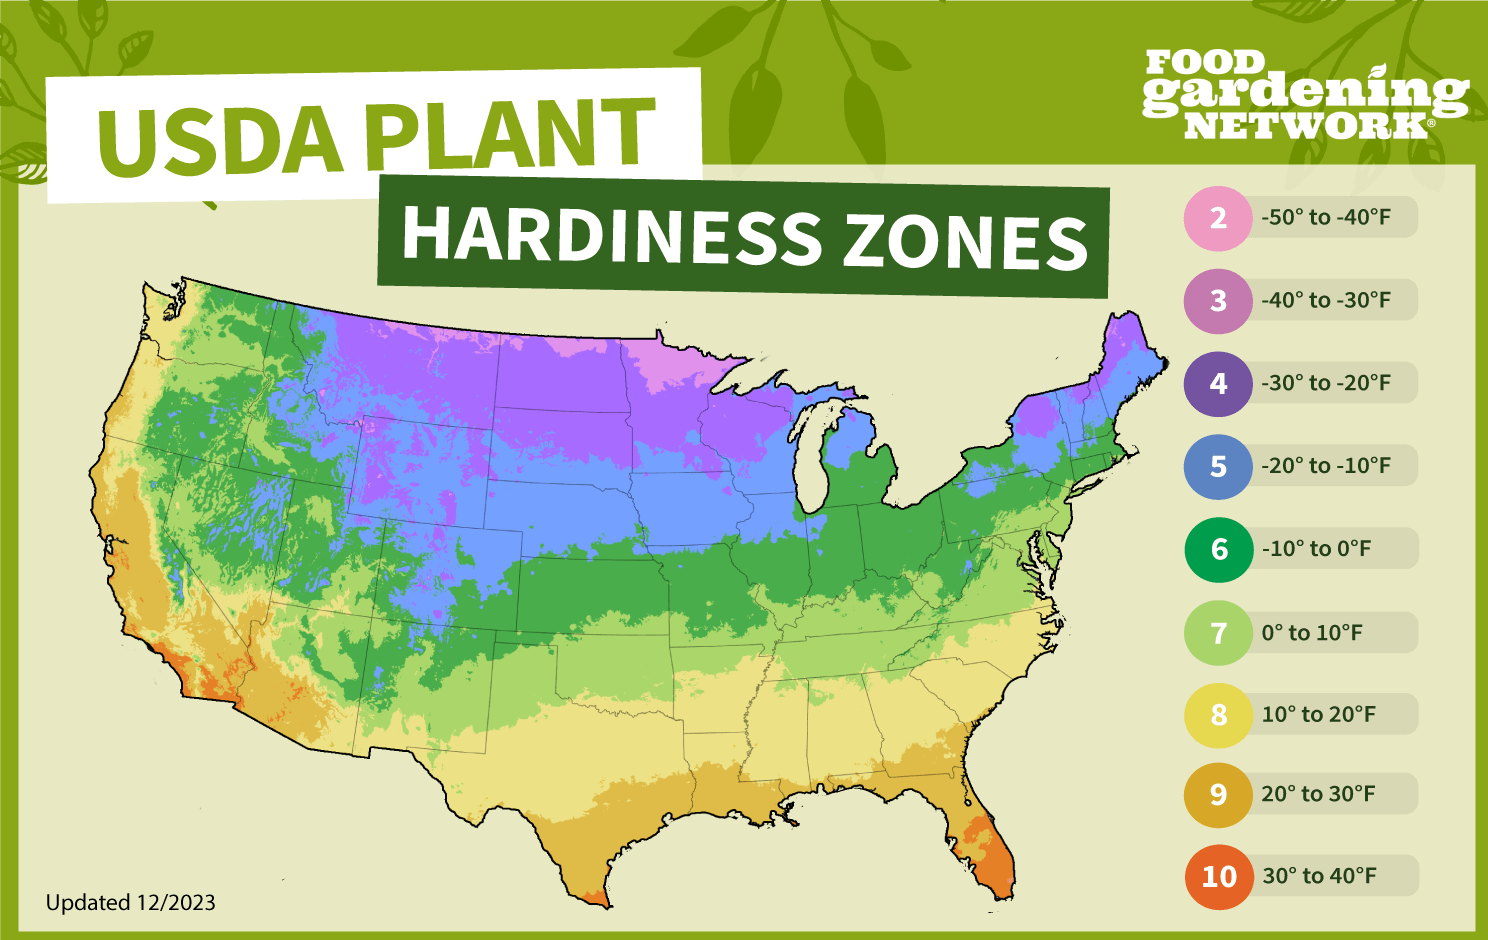
Plant zone maps are indispensable tools for gardeners, landscapers, and anyone interested in cultivating thriving flora. They provide a geographical framework for understanding which plants are most likely to survive and flourish in a specific location, based on climate conditions, primarily minimum winter temperatures. This comprehensive guide delves into the intricacies of plant zone maps, exploring their creation, interpretation, and practical applications.
Understanding the Foundation: Climate and Hardiness
The concept of plant zones hinges on the idea of plant hardiness, which refers to a plant’s ability to withstand the climatic extremes of a particular region. The most critical factor determining hardiness is the average minimum winter temperature. However, other factors like summer heat, rainfall, humidity, and soil type also play significant roles.

The USDA Plant Hardiness Zone Map: A North American Standard
The United States Department of Agriculture (USDA) Plant Hardiness Zone Map is the most widely recognized and utilized system in North America. It divides the continent into 13 zones, each representing a 10-degree Fahrenheit difference in average annual minimum winter temperature. Each zone is further subdivided into “a” and “b” sections, representing 5-degree Fahrenheit differences, offering even greater precision.
How the USDA Map Works
The map is based on 30-year averages of the lowest annual winter temperatures.
Limitations of the USDA Map
The map primarily focuses on minimum winter temperatures and does not account for other crucial factors like summer heat, rainfall, or soil type.
:max_bytes(150000):strip_icc()/ms-usda-gardening-zone-3a925f9738ce4122b56cde38d3839919.jpg)
Beyond the USDA: Global and Regional Zone Maps
While the USDA map is dominant in North America, other countries and regions have developed their own zone maps tailored to their specific climate conditions.
European Plant Hardiness Zones
Europe uses various zone systems, often adapted from the USDA model. However, some countries have developed their own systems to better reflect their unique climate variations.
Australian Plant Hardiness Zones
Australia has a diverse range of climates, from tropical to temperate.
Other Regional Maps

Many other countries and regions have developed their own zone maps, taking into account their unique climate characteristics.
Utilizing Plant Zone Maps Effectively
Plant zone maps are valuable tools, but it’s essential to use them in conjunction with other information to make informed gardening decisions.
Checking Plant Labels
Plant labels often indicate the hardiness zones in which a plant is expected to thrive.
Considering Microclimates
Pay attention to microclimates within your garden.
Accounting for Other Factors
Consider other factors like summer heat, rainfall, humidity, and soil type.
Adapting to Climate Change
Climate change is causing shifts in temperature patterns, potentially altering zone boundaries.
Practical Applications of Plant Zone Maps
Plant zone maps have numerous practical applications in gardening, landscaping, and agriculture.
Selecting Plants
Zone maps help gardeners choose plants that are most likely to survive and thrive in their area.
Planning Landscapes
Landscapers use zone maps to design landscapes that are both aesthetically pleasing and sustainable.
Agricultural Planning
Farmers use zone maps to determine which crops are best suited for their region.
Conservation Efforts
Conservationists use zone maps to identify areas that are suitable for specific plant species.
Conclusion: A Tool for Informed Gardening
Plant zone maps are essential tools for anyone involved in cultivating plants. They provide a valuable framework for understanding plant hardiness and selecting plants that are well-suited to a particular climate. However, it’s crucial to remember that zone maps are just one piece of the puzzle. Consider other factors like microclimates, soil type, and climate change to make informed gardening decisions. By understanding and utilizing plant zone maps effectively, you can create thriving gardens and landscapes that are both beautiful and sustainable.
